Prepare · Aesthetary Original
Browser developer tools in five minutes
You'll be able to open the console, network, styles and responsive view, and say what each one tells you.
In this skill
Open the tools, then reload.
Console: what broke, and where
- Open the Console tab
- Reload with it open
- Read the red lines first
- Note the file and the line
- Copy the message exactly
Open the tools before you ask. Each panel answers one question.
Transcript
You click plus on the bakery's order page, and nothing happens. The page looks fine, so looking harder won't tell you why. The browser can. Every desktop browser has developer tools built in, and four of their panels answer most questions.
Right-click anywhere on the page and choose Inspect. Or press F12, or on a Mac, Option, Command and I. A panel opens beside the page, and the page gets narrower to share the window. The tabs along the top are the tools.
Choose Console, then reload, because it only records what happens while it's open. One red line: Uncaught TypeError, cannot read properties of null. On the right, the file and the line: order.js, line three. Red lines are errors. Yellow ones are warnings, often harmless. You don't need every word. It says line three tried to use something from the page that wasn't there, which is why plus does nothing. Copy it exactly, file and line included, into your message to the AI. Once it's fixed, reload again. The console is empty, and plus adds a country loaf, at eight fifty.
Now the home page. Open Network and reload. Every file the page asked for is a row: the page, the stylesheet, the photo and two fonts. Read three columns. Status two hundred means it arrived, and four oh four means it's missing. Size is how much came down. Time is how long it took. This copy runs on my computer, so everything arrives at once. Set throttling to a slow phone connection, keep the cache off, and reload. Now the photo, one point three megabytes, takes seven point six six seconds. Everything else is done in under a second and a half.
To see why something looks the way it does, right-click it and choose Inspect. Here, the Place order button. Its code is selected in Elements, and the button is outlined on the page. Below it, Styles lists every rule that applies, with its file and line. The background comes from the button rule, at styles.css line forty-seven. It doesn't name a color. It says var, action: a named color, set somewhere else. Computed shows what the browser actually used: R G B thirty-one, seventy-seven, fifty-eight. That's the awning green, set once on line nine. So you can name the line, instead of asking for a greener button. You can try edits here too, and they're gone when you reload.
Last, the responsive view: the device button beside the tabs. Type a width. At three seventy-five, the home page lays itself out as it would on a phone that wide. Hover the photo in Elements. It's shown three seventy-five by one sixty-four, from a file four thousand by seventeen fifty. That's why it was the heavy row in Network. It's a width, not a phone: your computer's speed, a mouse instead of a finger. Use it to find problems quickly, then check the finished page on a real phone.
Write down what each panel told you, in its own words: the file and line, the size and time, the rule, the width. That's evidence the AI can act on, and that someone else can check.
Open the tools before you ask. The console says what broke, the network what loaded, the styles which rule won, and the responsive view what the width does.
Next 3
Everything in Prepare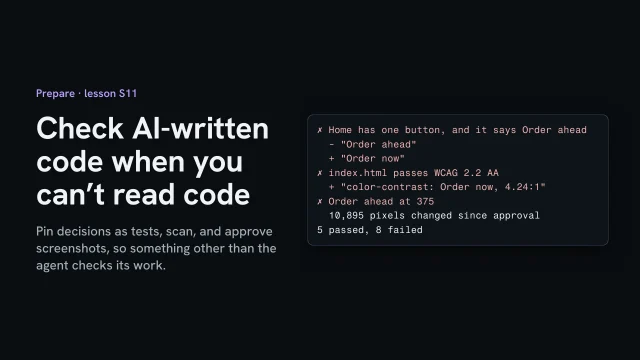 Check AI-written code when you can't read codePin decisions as tests, scan, and approve screenshots, so something other than the agent checks its work.3 min video
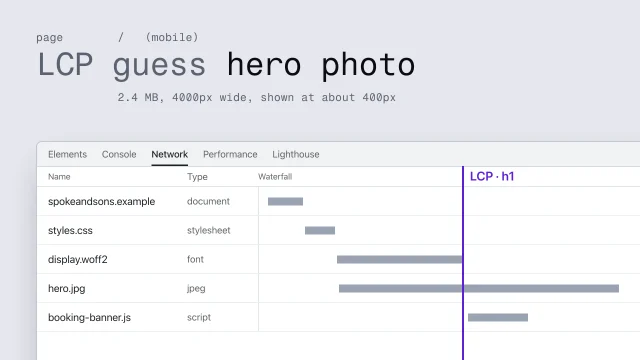 Predict, measure and fix performanceFind what makes a page slow and fix it at its origin.4 min video
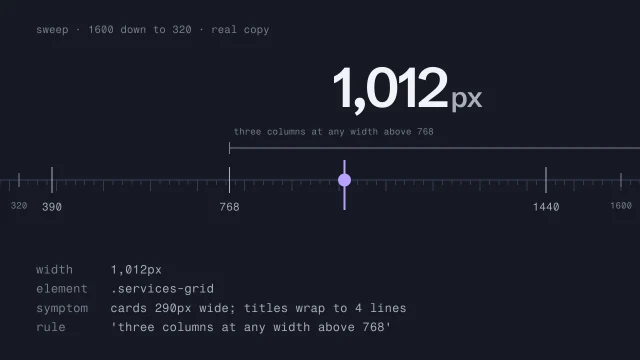 Test responsive behavior across every widthFind the exact width where a layout breaks.3 min video